Traffic Classification Demonstration
The traffic classification application suite was demonstrated by Condor Technologies as Innovation Demo in October 2025 on the Broadband Forum network booth at the Network-X event in Paris
An overview of this OB-CAS live demo can be seen in this clip:
Note that while this application makes use of the OB-CAS APIs, the application microservices have not been contributed as open source to the OB-CAS project. This page provides some general information on the overall design of the application and demo set-up.
About
This application will analyze time series data to categorize users into predefined groups. The purpose of this analysis is to identify users whose activity patterns do not align with their assigned group. This will help in recognizing potential discrepancies in user behavior.
The implementation will involve the following stages: First the application will be trained using data from users with known group associations. Second, it will classify new users and compare their behavior against their assigned group, generating alarms for mismatches. This process will run on a periodic schedule. Optionally, a third stage will involve incorporating the data from this classification process back into the application’s training data.
Design
Metric values are made available through a time series database, OpenTSDB, which stores both historical and current traffic data. For initial population and testing, a data simulator populates OpenTSDB with historical data for model training.
The core intelligence lies within the User Traffic Classifier (Machine Learning) microservice, which learns patterns from this historical data to classify users into predefined groups.
Periodically, the Traffic Anomaly Monitor reads recent traffic information from OpenTSDB. It then sends this data to the User Traffic Classifier to classify each user and detect anomalies.
Upon identifying a discrepancy, the Traffic Anomaly Monitor records the detailed findings in OpenSearch. Finally, the Frontend Web (or Visualizer App) retrieves monitoring data and anomaly records from these services, presenting the results graphically for easy understanding.
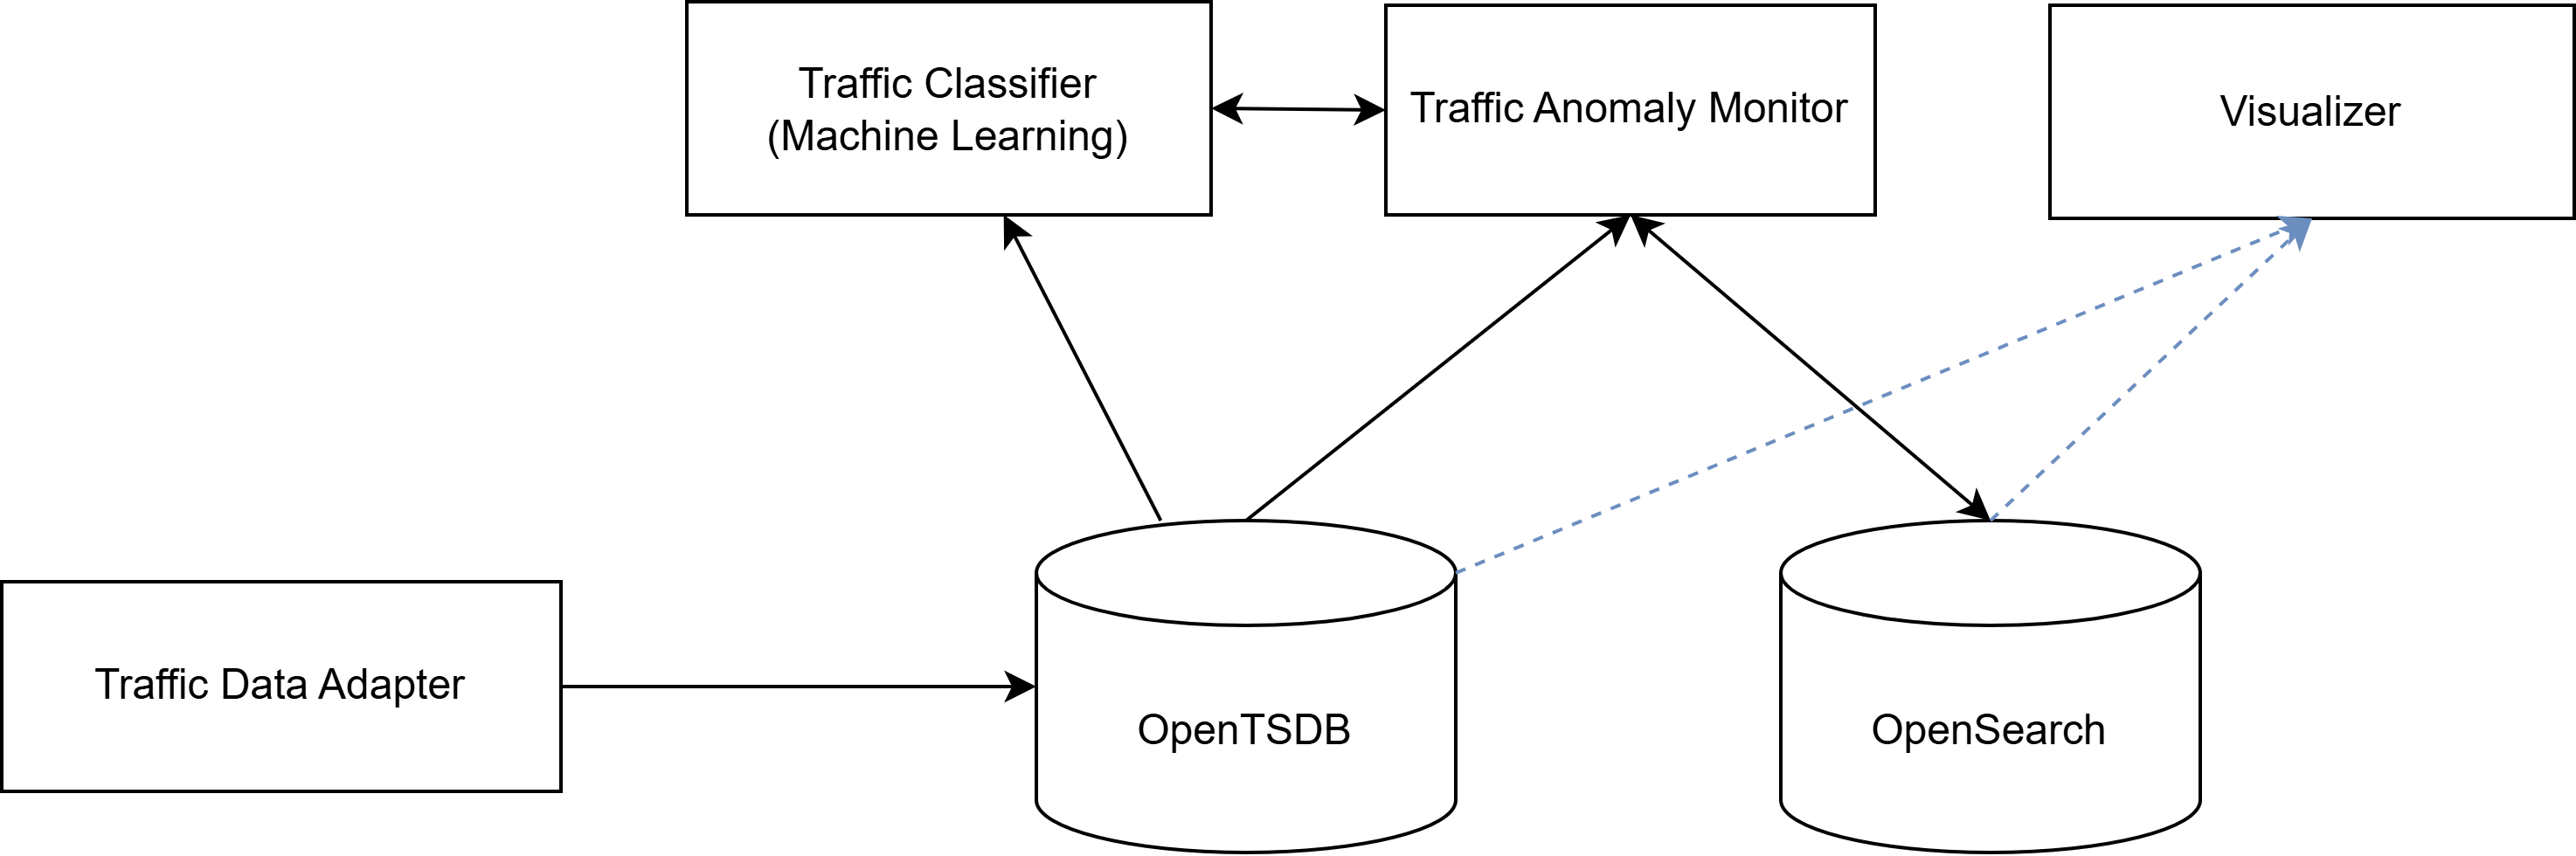
Fig 1: high level architecture for the Condor Traffic Classification App
Time series Data Simulator
It is a crucial component for both initial setup and ongoing testing of the system, labeled as “Traffic Data Adapter” in above figure.. It has two main functions:
-
Historical Data Injection: It performs a one-time load of historical traffic data into OpenTSDB, spanning a defined start and end date with a specified periodicity. This historical dataset is then used to train the machine learning model.
-
Continuous Live Data Simulation: After the initial historical load, it continuously inserts simulated current traffic data into OpenTSDB at regular intervals. This provides a constant stream of “live” data, allowing the Traffic Anomaly Monitor to operate and test the system’s real-time detection capabilities.
Microservice 1: User Traffic Classifier (Machine Learning)
This is a dedicated microservice that embodies the core intelligence of the application:
-
During the Training Process: It accesses historical traffic data from OpenTSDB to train its clustering and anomaly detection model. Once trained, these models are then saved locally.
-
During Operation: It loads the pre-trained models. It exposes an API endpoint (e.g., /classify_traffic) that receives new traffic data from the Traffic Anomaly Monitor. It then processes this data, classifies the user into a learned group, and determines if their current behavior is anomalous relative to their group’s historical patterns.
Microservice 2: Traffic Anomaly Monitor
This microservice acts as the orchestrator for continuous anomaly detection and enables the following:
-
Periodic Data Collection: It periodically queries OpenTSDB to retrieve the latest traffic metrics for active ONTs.
-
Interaction with User traffic classifer: It sends this recent traffic data to the User Traffic Classifier (Machine Learning) microservice to get classifications and anomaly detection results. It also reads from the Open search the user group to be sent to the Classifier with the traffic data.
-
Alerting: Upon detecting an anomaly, it saves the anomalies into Opensearch to allow being queried by the Visualizer or other application in the future.
Microservice 3: Visualizer/User Interface (UI)
This web application provides an intuitive interface for visualizing and simulating user traffic anomalies. It’s designed to help better understand traffic behavior and to discover deviations.
The UI is structured into two main sections:
Historical Data and Average Traffic Visualization
In this section, users will be able to access historical traffic data and view average traffic data for existing classification groups. This provides a baseline for understanding typical behavior patterns before introducing anomalies.
Anomaly Simulation and Analysis
This is the core functionality of the application, with following capabilities:
-
Select a current user: allows to choose a specific user for whom an anomaly must be generated.
-
Generate an anomaly: allows to define a period of time during which the selected user’s traffic will “fall out” of the expected range for their classification group.
-
Run the simulator: triggers the simulator to insert the generated anomalous data directly into OpenTSDB.
-
Visualize anomalies: shows a summary of the anomalies generated for a specific period.
-
Graphical comparison: allows to view a graph that compares the individual user’s anomalous traffic with the average traffic of their classification group, making it easy to identify deviations.
This application will serve as a tool for exploring, simulating, and analyzing unusual traffic scenarios, allowing for better understanding and preparation for potential deviations in user behavior.